The OP graph is just absolute count on the y axis, so I also assumed it was basically measuring LoC, but looking at this chart, the em-dashes do appear to be definitely more of a modern phenomenon compared to raw LoC:
Maybe some policy/tooling change around 2014? A guess is perhaps something to do with allowing UTF-8 in source files, but that’s a pretty long shot.


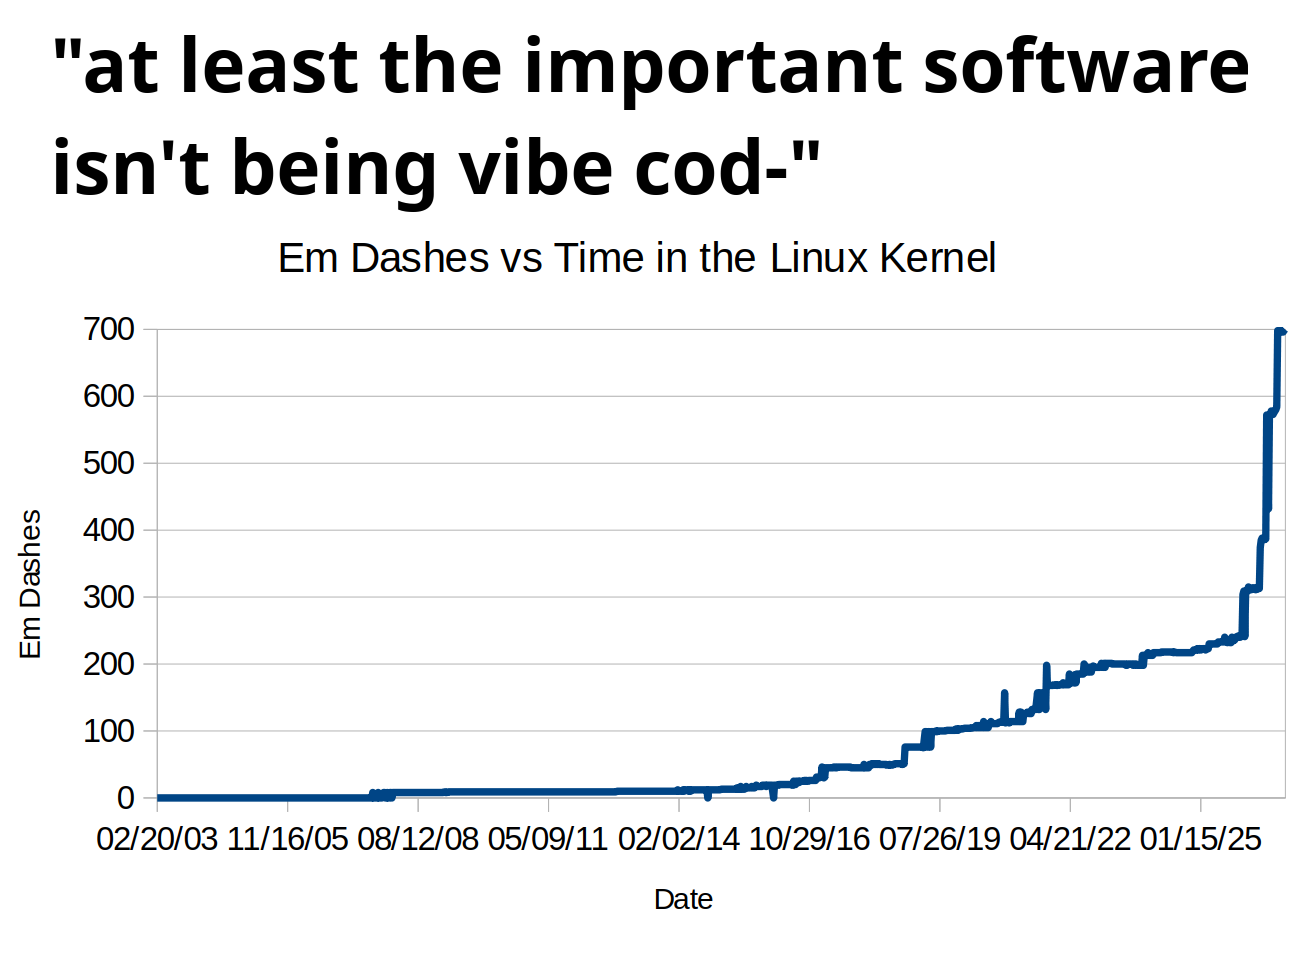
The OP graph is just absolute count on the y axis, so I also assumed it was basically measuring LoC, but looking at this chart, the em-dashes do appear to be definitely more of a modern phenomenon compared to raw LoC:
Maybe some policy/tooling change around 2014? A guess is perhaps something to do with allowing UTF-8 in source files, but that’s a pretty long shot.
Looking at that, the lines of code cannot really be the full story. M-dash count really just appears to rise from 2014 onwards.